Already we are into February and the new recruits will have started to arrive to take up their new positions.
It’s a good time to reflect on the hire and induction costs.
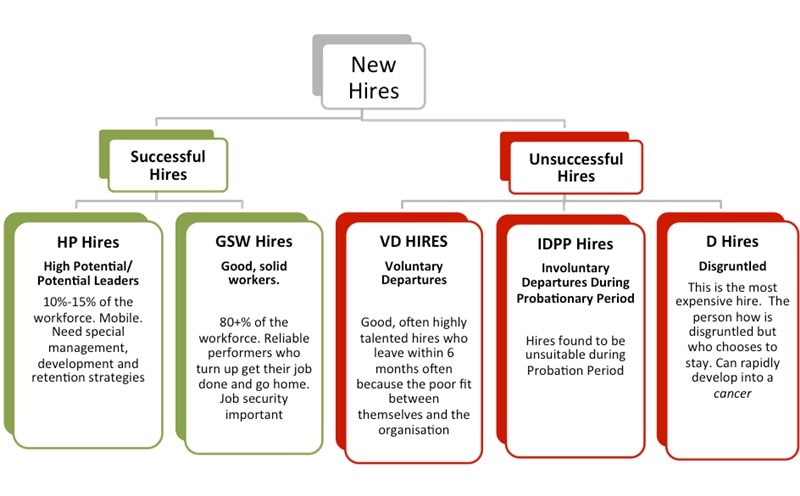
A starting point is to divide your hires into 5 categories using the following schema.

You might ask what is an acceptable unsuccessful hire rate?
That is a piece of a string question, all unsuccessful hires add significant cost. However, there should be a major focus on minimising/preventing cost at source – the entry point.
Once people are on-the-bus, particularly the disgruntled, cost can run up very quickly and expensively.
The US recruiting firm Robert Half International (RH) researched this in a paper titled The Surprising Costs of a Bad Hire, and this research has provided some interesting stats on the cost of bad hires.
In the study CFOs said that supervisors spend 17% of their time, that is close to a day a week, managing poor hires.
This research notes that 39% of hiring managers and HR professionals said that poor hires cost productivity. Nothing new in that, still, 39% is a sobering figure.
The adverse impact of bad hires on organisational culture, morale and engagement is stuff of legend with around 9% of a workforce being disengaged.
Now not all disengaged workers started off being disengaged and there are numerous reasons why good employees become disengaged but the bottom line cost is still incurred where the disengagement was a recruiting or management mistake.
Of course lost productivity during exit time, recruiting time (often 5-8 weeks) and learning curve costs add a very big chunk of bottom-line cost. These lost productivity costs are in addition to agency fees, HR and management time involved in the recruitment, selection and induction process.
It is easy to identify and quantify many recruiting and induction costs. These visible costs are really just the tip of the iceberg.
It is very important to look below the surface as to where the really hefty cost are.


